Sellers have made a strong comeback in the Bitcoin markets as the price drops 1.37 percent to $226, breaking the tiring consolidation and improving the prospects of a big move.
For the past several sessions, Bitcoin traded near $230-235 but as the global markets fall, pressure can be felt in this market as well. Bitcoin, being a highly volatile cryptocurrency, may give huge negative returns in the future sessions.
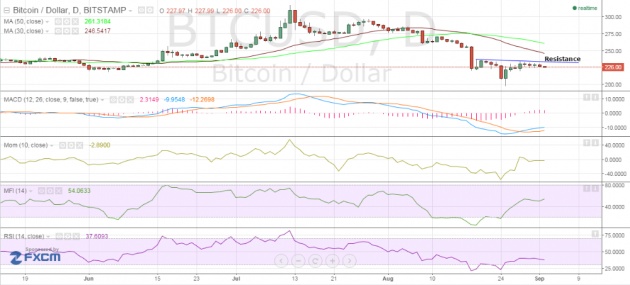
Take a look at the daily BTC-USD price chart and find out what the latest technical indications are telling.
Bitcoin Chart Structure – There is not much change in the chart structure except that the current decline is looking like a breakdown.
Moving Averages – The 30-day SMA of $245.5417 is sharply lower than the 50-day SMA of $261.3184. There is no sign of the bearish crossover being reversed.
Moving Average Convergence Divergence – The MACD has edged up to -9.9548 while the Signal line has halted its decline and is now at -12.2698. This gives the Histogram a value of 2.3149.
Momentum – The Momentum reading is a tad below the 0-mark at -2.8900.
Money Flow Index – The Money Flow is only marginally changed at 54.0633.
Relative Strength Index – The RSI is reflecting the pessimism with its value of 37.6093.
Conclusion
Taking a look at the chart structure and the latest technical indicator readings, I believe that now may be another good time to go short on Bitcoin for a target of $215. Expect to see sub-$200 levels after $215 is breached. Volatility may soon see an uptick, so do place tight stop-losses.
Low-risk traders can consider building light short positions now and increase if the market provides them with a bounce. Book partial profits as support levels are met.
This may be the big move that the market participants have been waiting for.
Source: http://www.newsbtc.com/2015/09/02/bitcoin-price-technical-analysis-for-292015-sellers-return/