When is the last time you opened Microsoft Excel to do some data science? If it's been a while, you're missing out.
It's hard to have a discussion about data science tools (and there's a lot of that going on) without bringing up R, Python, and the rest of the darlings in the corral of data science favorites, but what about Excel? I'm sorry if Excel's not sophisticated enough for your data science needs -- or so you think. Microsoft Excel has been a secret weapon of mine for decades -- it has been my ubiquitous data tool -- and becoming a data scientist didn't stop me one bit from using it. Here are five things about Excel that every data scientist should know.
1: Named ranges
Named ranges are a quick way to create a makeshift database in Excel. In simple terms, a named range is a table of data that has a label for easy reference. No need to get fancy: column headings across the top row and then rows of data below, following the typical structure of any data table.
There are several ways to assign your custom name to the table, but I find it easiest to just click in the top left corner (where the cell reference is displayed) and start typing. I typically think of these as lookup tables, so I usually use the "lkp" prefix when naming them. Put your primary key in the leftmost column and then use the VLOOKUP function anywhere in your workbook to find any value in your table.
2: Sorting and filtering
As soon as you have your named range in place, you can sort and filter with one click of the filter button. This is a fast and easy way to explore your data set and possibly highlight interesting rows or cells.
Once the range is in filter mode, it's good to inspect the filter drop-downs to get a sense of the data in your data set. Excel's okay with combining types, so you can quickly spot data errors just by looking at the different values in the filter drop-down. There's also an extremely powerful Advanced Filtering functionality that allows you to filter your data set based on criteria you specify in another range.
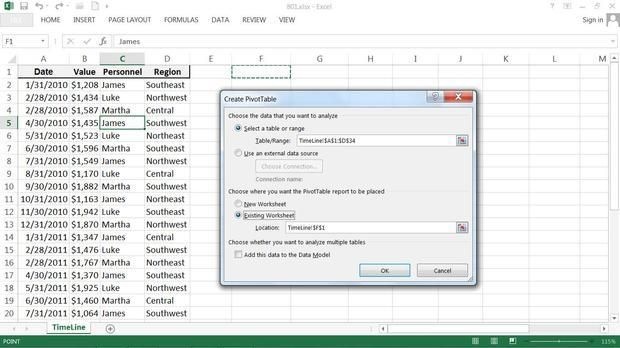
3: Pivot tables
Pivot tables are a quick and easy way to slice and dice data. Although not as fully functional as a full-blown business intelligence tool, pivot tables in Excel do a respectable job of quickly cross-tabulating data and calculating counts, sums, and other aggregate metrics.
With your named range in place (are you getting the sense of how fundamental these are when working with Excel?), click the pivot table button and then tell Excel where you want it to go. For small jobs, I'll just put the pivot table next to the named range; for larger jobs, I'll give the pivot table its own sheet. Now just drag and drop columns, rows, and values (metrics) to dynamically create your cross-tab analysis. It's not Business Objects, but it's not bad for a spreadsheet tool.
4: Conditional formatting
Conditional formatting is fun, and I hope Microsoft expands this functionality a bit in the future. As its name implies, this feature allows you to format cells based on criteria you specify (instead of static formatting where the cell always holds the same formatting).
For instance, you could tell Excel to format/highlight all cells in a named range that are above a certain value. And if you want to get fancy, you can tell Excel to format cells based on a formula that involves other cells. Excel has some built-in formats that make it easy to quickly create a heat map or even an icon overlay. However, you're limited on the icons you can select, and you cannot easily extract the exact color from a heat map. Overall though, it does the trick for most situations.
5: Visual Basic
We come to the most powerful feature Excel has to offer: Visual Basic. That's right, Visual Basic. I know what you're thinking -- you're far too advanced for Visual Basic, right?
Visual Basic and Excel are awesome in the hands of a data scientist. You already know how to program, so picking up Visual Basic won't be hard. And Visual Basic opens up a whole new world of creative solutions with Excel -- everything from creating your own Excel-based neural network, to Monte Carlo simulations, to anything else you can dream up.
Excel does have its limits, so don't push it. For the hard-core work, you're much better off with R or Python. But don't discount Excel for a quick prototype or proof-of-concept.
Summary
Although Excel isn't a top resume-building skill for data scientists, you'd be remiss if you didn't learn its ins and outs. Over and above the obvious features, which handle statistical and mathematical formulae pretty well, Excel is a respectable data management and programming tool.
First learn the basics of named ranges and filtering, and then move on to more advanced features like pivot tables and conditional formatting. Finally, learn Visual Basic for Excel. It's really not hard to pick up one more language, and it's well worth the trouble. And don't worry -- nobody will take away your data scientist badge for learning Excel.