Operating Income Margin
|
Details |
Unit |
2010 |
2009 |
2008 |
2007 |
2006 |
|
Operating Income Margin |
% age |
(3.2) |
8.0 |
(2.64) |
(12.3) |
9.5 |
|
Average |
|
5.833 |
9.0328 |
1.5306 |
-4.2468 |
7.698 |
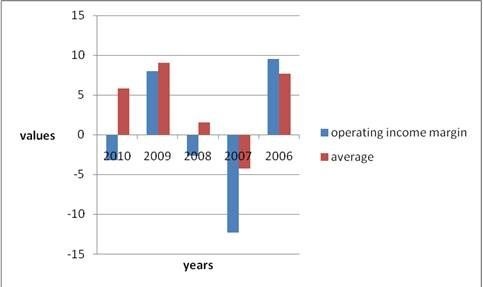
Interpretation:
Operating income margin is negative in three years out of five years it is a problem for company. Operating income margin is below the average except2006 this is not good.
Operating Assets Turnover
|
Details |
Unit |
2010 |
2009 |
2008 |
2007 |
2006 |
|
Operating Assets Turnover |
times per year |
0.70 |
0.67 |
0.48 |
0.42 |
0.85 |
|
Average |
|
47.906 |
33.25 |
20.904 |
27.2164 |
39.038 |
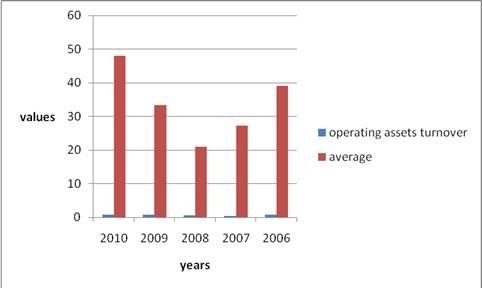
Interpretation:
Operating assets turnover is improving this appears to be very good. Operating assets turnover is below the average it is not good.
Return on Operating Assets
|
Details |
Unit |
2010 |
2009 |
2008 |
2007 |
2006 |
|
Return On Operating Assets |
% age |
(2.2) |
5.4 |
(1.27) |
(5.2) |
8.0 |
|
Average |
|
19.3494 |
16.5312 |
0.5642 |
0.1464 |
12.7362 |
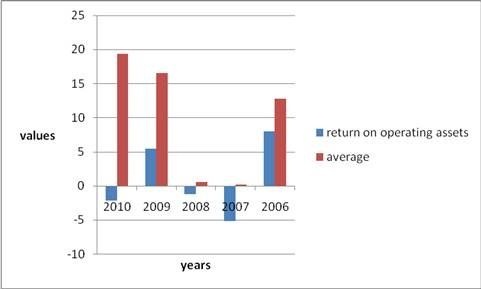
Interpretation:
Return on operating assets is negative in 3 years out of 5 it is problem for company. Return on operating assets is less than average it is not good.
Sales to fixed assets
|
Details |
Unit |
2010 |
2009 |
2008 |
2007 |
2006 |
|
Sales to fixed assets |
times per year |
0.859 |
0.864 |
0.62 |
0.622 |
1.187 |
|
Average |
|
3.8692 |
2.7688 |
1.9648 |
2.5142 |
2.7134 |
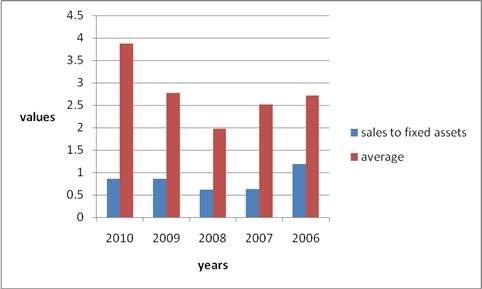
Interpretation:
There is a little improvement in sales to fixed assets after decreased it is very good. Sales to fixed assets is less than average it is not good.