Return on Investment
|
Details |
Unit |
2010 |
2009 |
2008 |
2007 |
2006 |
|
Return On Investment |
% age |
(3.5) |
2.1 |
(1.47) |
(10.72) |
1.98 |
|
Average |
|
12.1128 |
27.408 |
8.9606 |
-10.852 |
13.7288 |
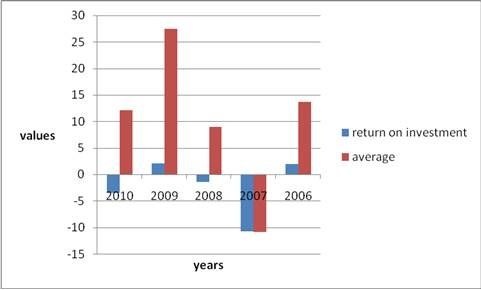
Interpretation:
Return on investment is negative except 2006and2009 this is not good. Return on investment is less than average it is not good.
Return on total Equity *
|
Details |
Unit |
2010 |
2009 |
2008 |
2007 |
2006 |
|
Return on total Equity |
% age |
(10.4) |
1.99 |
(5.7) |
(21.2) |
1.67 |
|
Average |
|
17.4914 |
25.8126 |
-0.1662 |
-17.457 |
17.54544 |
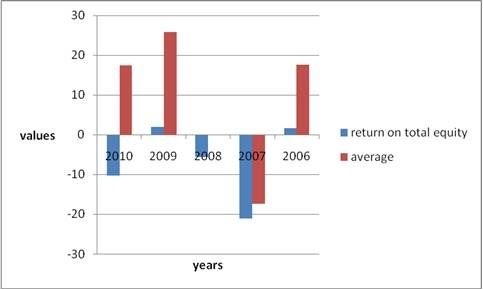
Interpretation:
Return on total equity is negative except 2006and2009 it is not good. Return on total equity is less than average it is not good.
Gross Profit Margin
|
Details |
Unit |
2010 |
2009 |
2008 |
2007 |
2006 |
|
Gross Profit Margin |
% age |
1.9 |
13.2 |
3.67 |
(5.2) |
15.1 |
|
Average |
|
8.6398 |
12.5216 |
6.4158 |
-0.0466 |
10.0748 |
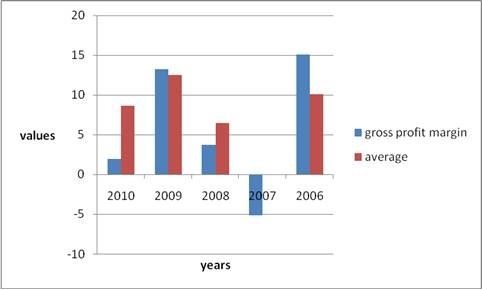
Interpretation:
In 5 years gross profit margin is +ve with a small amount except of2007.now it is decreasing that is not good. Gross profit margin is less than average except 2006,2009 it is not good.
Return on common equity *
|
Details |
Unit |
2010 |
2009 |
2008 |
2007 |
2006 |
|
Return on common equity |
% age |
(10.4) |
1.99 |
(5.7) |
(21.2) |
1.67 |
|
Average |
|
17.4914 |
25.8126 |
2.8738 |
-15.117 |
17.42544 |
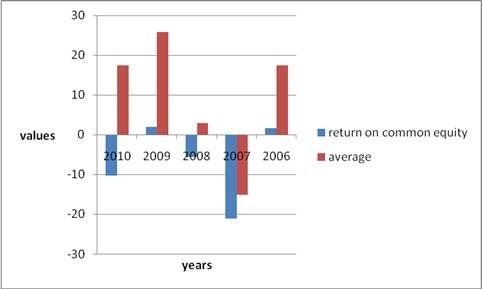
Interpretation:
Return on common equity is same to the return on total equity. Return on common equity is less than average it is not good.