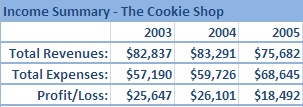
1) Enter the chart data.
2) don't give any empty cell.
3) Drag to select the data,
4)Click the top left of the column.
5) Holding the shift key, and press the down arrow key to select the data.
6) Go to insert menu.
7) select the chart option
8) Click on the desired chart , and press ok button.
9) your chart is done..