Matlab is a powerful tool or software which has made the life of an engineer very simple, it solves all of the problems very efficiently and correctly. it has vast applications in all of the fields of engineering and technology including mathematicians, it also do mathematical computations very quickly.
here are few commands which we will understand:
Q # 1 :
To find the fourier’s series and fourier coefficents:
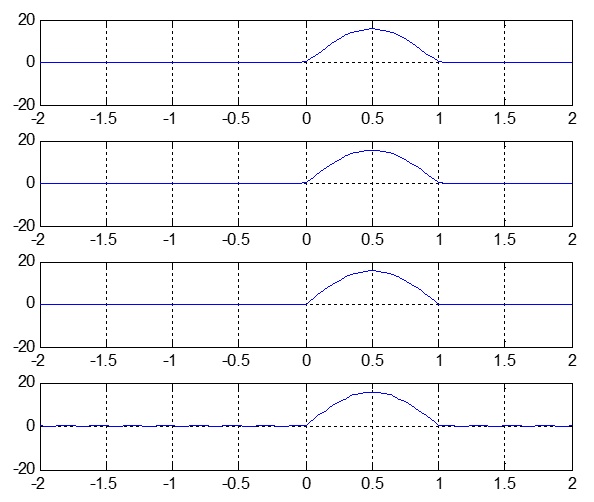
F (x)=0 if -pi <= x < 0; and f (x)=1 if 0<=x<pi
And the f (x + 2*pi) = f(x):
We have to write a code in matlab for implementing the fourier series by using the given following harmonics.
H1=[3 20 33 100]. We should the command of subplot to plot all the results of harmonic.
Sloution:
Finding of a0,an,bn in command prompt
>> syms xTn
>> T = pi;
>> ao = ( 1/ (2*T) ) * int ( 0,x,-pi,0 ) + ( 1/ (2*T) ) * int ( 1, x, 0, pi )
ao = 5734161139222659 / 36028797018963968 * pi
>> an = ( 1/T ) * int ( 0 * cos ( n * x ) , x , -pi , 0 ) + ( 1 / T) * int ( 1 * cos ( n * x ) , x , 0 , pi )
an = 734161139222659 / 18014398509481984 * sin ( pi * n ) / n
>> ( 1 / T ) * int ( 0 * sin ( n * x ) , x , - pi , 0 ) + ( 1 / T ) * int ( 1 * sin ( n * x ) , x , 0 , pi)
ans = - 5734161139222659 / 18014398509481984 * ( cos ( pi * n ) - 1 ) / n
M-file code for fourier series
function [ t, frsr] = q * 1 * fs (har, tmax)
fo = 1 / ( 2*pi ) ;
wo = 2*pi*fo ;
t = - tmax : 0.05 : tmax ;
n = 1 : har ;
ao = 5734161139222659 / 36028797018963968 * pi ;
an = 5734161139222659 / 18014398509481984. * sin(pi.*n). / n ;
bn = -5734161139222659 / 18014398509481984.* (cos (pi. *n) -1 ) ./ n ;
y = zeros ( har, length (t) );
for n = 1:har,
>> y (n, : ) = an(n) * cos(n * wo * t) + bn(n) * sin(n * wo * t) ;
End // end of for loop
frsr = ao + sum ( y, 1 ) ;
in the Command Prompt window of our matlab write the following code:
tmax = 2 * pi ;
for I = 1 : 4 ,
har = [ 3 20 33 100 ] ;
[ t, frsr ] = q1fs(har(i) , tmax) ;
Subplot ( 4, 1, i);
plot (t, frsr) ;
grid ;
end
the following output will appear on the output window of matlab:
Q # 2 :
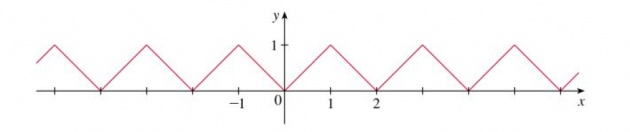
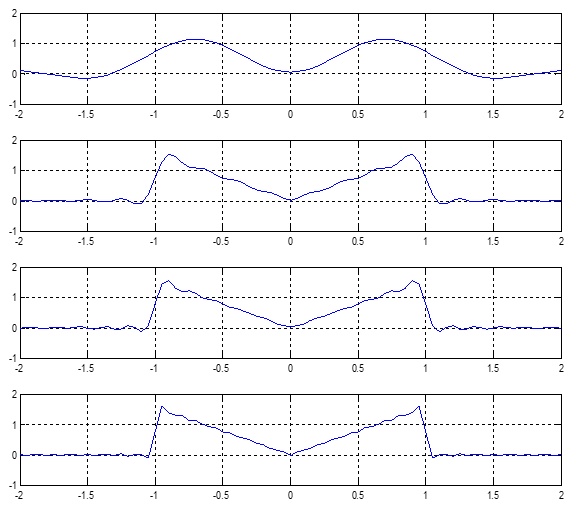
Find the Fourier series function of the of the triangular wave defined by f(x)=|x| for
-1 < x < 1 for f(x+2) = f(x) for all x. The graph of the variable ‘x’ is shown below
Commands for Finding of a0, an and the bn in command prompt
syms x T n
T = 2 ;
>> ao = (1 / (2 * T)) * int(abs(x), x, -1, 1) ;
>> ao = 1/4 ;
>> an = (1 / T) * int(abs(x) * cos(n * x), x, -1, 1) ;
>> an = (cos(n) + n * sin(n) - 1) / n ^ 2 ;
>> bn = (1/T) * int(abs(x) * sin(n * x), x, -1, 1) ;
>> bn = 0 ;
M-file code for finding the fourier series of the given :
>> function [t, frsr] = q2fs(har, tmax)
>> fo = 1 / (2 * pi) ;
>> wo = 2 * pi * fo ;
>> T = -tmax : 0.05 : tmax;
>> n = 1 : har ;
>> ao = 1 / 4 ;
>> an = ( cos (n) + n.* sin(n)- 1) ./ n .^2 ;
>> bn = zeros(1, length(n)) ;
>> y = zeros(har, length(t)) ;
for n = 1 : har, // starting for loop
y (n, :) = an(n) * cos(n * wo * t) + bn(n) * sin(n * wo * t) ;
end
frsr = ao + sum(y, 1) ;
now on the Command Prompt window of the matlab window write the following code :
>> tmax = 2 ;
>> for I = 1 : 4 ,
>> har = [ 5 25 33 50 ] ;
>> [t, frsr] = q2fs(har(i), tmax) ;
>> subplot ( 4, 1, i) ;
>> plot(t, frsr) ;
>> grid ;
>> end
the following output will appear on screen:
Q # 3
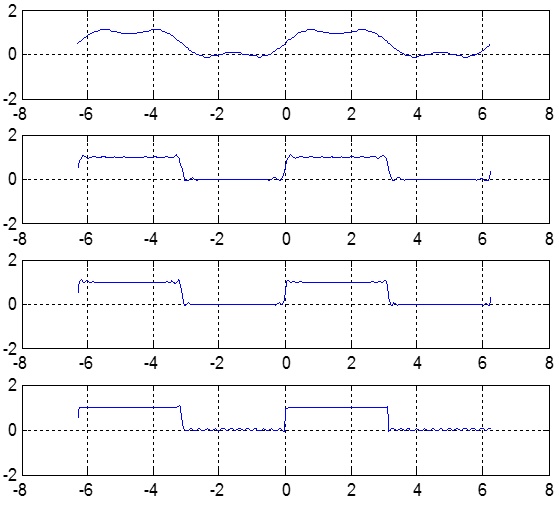
A voltage Esinwt where t represents time, is passed through a so called half wave rectifier that clips negative part of the wave. Find the Fourier series of the resulting function using MATLAB.
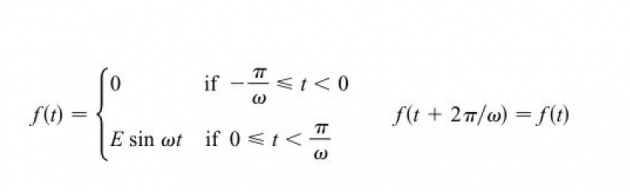
Where E=5, w=pi.
Use harmonic H=[20 40 60 100]. Use subplot to plot all the harmonics result.
SOLUTION of the Q# 03:
Finding of a0,an,bn in command prompt
>> E = 5 ;
>> w = pi ;
>> T = pi / w ;
>> syms w t T n
>> ao = (1/(2 * T)) * int(0, t, -pi / w, 0) + ( 1/(2 * T)) * int(E * sin(w * t), t, 0, pi / w) ;
>> ao = 5/T/w ;
>> an = (1/T) * int(0 * cos(n * t), t, -pi /w, 0) + (1/T) * int (cos(n * t) * E * sin (w * t), t, 0, pi/w) ;
>> an = -5/T * (cos (pi / w * n) + 1) * w / (n + w) / (n - w) ;
>> bn = (1/T) * int(0 * sin(n * t), t, -pi / w, 0) + (1/T) * int(sin(n * t) * E * sin(w * t), t, 0, pi/w) ;
>> bn = -5/T * w * sin (pi/w * n) / (n^2 - w^2) ;
The M-file code for fourier series finding :
function [t, frsr] = q3fs(har, tmax)
>> w = pi;
>> T = pi/w;
>> fo = 1/(2 * pi) ;
>> wo = 2 * pi * fo ;
>> t = -tmax : 0.05 : tmax ;
>> n = 1 : har;
>> ao = 5./T./w ;
>> an = -5./T.*( cos(pi./w .* n) + 1) .* w./(n + w) ./ (n - w) ;
>> bn= -5 ./ T .* w .* sin (pi ./ w .* n) ./ (n .^ 2 - w .^ 2) ;
>> y = zeros(har, length(t)) ;
>> for n = 1:har, // applying here the for loop controlled loop to find the Fourier series
y(n , :) = an(n) * cos(n * wo * t) + bn(n) * sin(n * wo * t) ;
end
>> frsr = ao + sum (y , 1) ;
in the window of Command Prompt write the following code :
>> tmax = (2 * pi) / w ;
>> for i = 1 : 4, // for loop starting from here
har = [20 40 60 100] ;
[t, frsr] = q3fs(har(i), tmax) ;
Subplot (4, 1, i) ;
plot (t, frsr) ;
grid ;
end // for loop ending here
the following output will appear on screen of the matlab window: