Convolution Method
In convolution two number produce third one which multiplication of first two.
If we want to get LTI output then we used convoultuion method.
CTC(Continuous time convolution)
DTC(Disceret time convolution)
CT CONVOLUTION IN MAT LAB:
ThE concept of the convolution is same as we calculated by mathematically
In the mat lab we use the build in function
Y=conv(u,v)
Deconvolution in Matlab:
For Deconvolution in matlab we use the command of
D=deconv(y,h)
Here y is the convolution of two signals and h is the impulse response of the signal
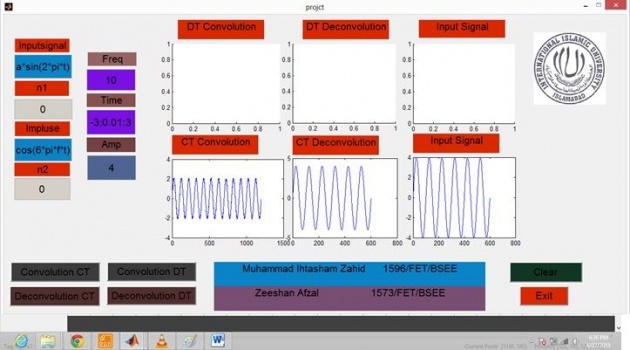
Convolution and Deconvolution on GUI:
we use the following feature of the GUI in our project
Static box(Static Text):
Names of static boxes:
Showed in Picture(1)..
Variable box(Edit text):
NO Name of string Name of tag
1 0 U
2 0 n1
3 0 H
4 0 n2
5 0 amp
6 0 T
7 0 F
Axis:
No Name of the tag
1 Axis1
2 Axis2
3 Axis3
4 Axis4
5 Axis5
6 Axis6
How to access the data from the variable box by giving the following command:
star2num(get(handlaes.name of box,’string’))
to show the out put on the axis we used the following command
axes(handles.name of axis name)
plot() or stem()
PUSH button:
In our GUI project we use foure push button to show the out put in the graphs
We did our all programing in the function of pushbootens
Push Buttons are shown in Picture(1)

Coding of Buttons:
DT convolution and DT Deconvolution Coding:
function conv_Callback(hObject, eventdata, handles)
global y u h
u=str2num(get(handles.u,'string'))
n1=str2num(get(handles.n1,'string'))
h=str2num(get(handles.h,'string'))
n2=str2num(get(handles.n2,'string'))
ki=n1(1)+n2(1);
ke=n1(length(n1))+n2(length(n2));
k=ki:ke;
y=conv(u,h);
axes(handles.axes4)
stem(u)
axes(handles.axes1)
if k==0
hold on
stem(y)
hold off
else
stem(k,y)
end
function deconv_Callback(hObject, eventdata, handles)
global y h
d=deconv(y,h)
axes(handles.axes2)
stem(d);
CT convolution and CT Deconvolution Coding:
function convct_Callback(hObject, eventdata, handles)
global y1 h
t=str2num(get(handles.t,'string'))
f=str2num(get(handles.fr,'string'))
a=str2num(get(handles.amp,'string'))
u=eval(get(handles.u,'string'))
h=eval(get(handles.h,'string'))
axes(handles.axes6)
plot(u);
y1=conv(u,h)
axes(handles.axes3)
plot(y1)
function dee_Callback(hObject, eventdata, handles)
global y1 h
d1=deconv(y1,h)
axes(handles.axes5)
plot(d1)
Clear
function clear_Callback(hObject, eventdata, handles)
% hObject handle to clear (see GCBO)
% eventdata reserved - to be defined in a future version of MATLAB
% handles structure with handles and user data (see GUIDATA)
set(handles.u,'string','0')
set(handles.n1,'string','0')
set(handles.h,'string','0')
set(handles.n2,'string','0')
set(handles.t,'string','0')
set(handles.fr,'string','0')
set(handles.amp,'string','0')
cla(handles.axes1,'reset')
cla(handles.axes2,'reset')
cla(handles.axes3,'reset')
cla(handles.axes4,'reset')
cla(handles.axes5,'reset')
cla(handles.axes6,'reset')
Exit
function exit_Callback(hObject, eventdata, handles)
close all;
For Starting Sound and Adding an image on GUI Layout:
function projct_OpeningFcn(hObject, eventdata, handles, varargin)
i=imread('C:\Users\Ihtasham Zahid\Desktop\4.jpg');
axes(handles.axes9);
imshow(i);
g=wavread('C:\Users\Ihtasham Zahid\Desktop\3.wav');
hold on
axes(handles.axes6);
wavplay(g);