The middle overs in T20s usually don't get much attention, but how well teams perform with bat and ball in those overs often has a huge bearing on the result
Shane Watson has the best strike rate, but Virat Kohli's dot-ball percentage is the lowest in the middle overs since the beginning of 2012 © ESPNcricinfo Ltd
A lot of attention and analysis in T20 cricket is focused on the Powerplay and the last five overs. That's fair enough too, for those are the passages of play when plenty of action happens, both in terms of runs and wickets. However, T20 results are often decided by how teams handle the middle overs. Batting teams which score reasonably briskly keeping wickets in hand ensure that they have an ideal launching pad for the last five overs; equally, key wickets during the middle overs ensure that the bowling team drastically reduces the ammunition available with the opposition to strike meaty blows towards the end. Teams with strong records in this format are invariably those which handle the middle overs well, with both bat and ball.
Teams have gradually got used to the 20-over template over the last few years, but a look at the stats indicate that the middle overs have seen the most change in the last few years. Comparing the T20I numbers in the last four years (2012 onwards) to those from the previous four-year period (2008-2011), the scoring rate has increased more in the middle overs than it has in other phases of the 20-over game. In the first six, the run rate has remained exactly the same - 7.28 - between 2008 and 2011, and since 2012. In the last five, the rate has increased marginally, from 8.71 to 8.93, which is increase of 2.5%. In the middle overs, the rate has gone up from 6.77 to 7.26, which is an increase of 7.2%. Batsmen have scored faster, but at the same time the average has increased too - from 22.68 to 25.40 - which suggests they have figured out the way to score quickly while taking fewer risks.
STATS IN THE MIDDLE OVERS (6.1 TO 15.0) IN T20IS
Period
Average
Run Rate
Balls/Boundary
2008-2011
22.68
6.77
10.08
2012 Onwards
25.40
7.26
8.60
The two teams who are on top of the ICC T20I rankings are also the teams with the best numbers in the middle overs of T20Is in the last four years. Both teams have averaged around 7.5 runs per over, but haven't lost too many wickets in the middle overs, ensuring they have wickets in hand to make use of the final overs. On the other hand, both teams have taken plenty of wickets in the middle overs - their bowling averages are in the early 20s - thanks to the effectiveness of their spinners. That means opposition teams have fewer wickets in hand, and possibly batsmen who are not well set, going into the last few overs.
South Africa's batting average during the middle overs is 35.67, at a run rate of 7.6. Multiplying their average by the runs scored per ball, their batting factor is a healthy 45.18. Similarly, their bowling factor (bowling average multiplied by runs conceded per ball) is 27.54. The difference between the two indicates how effectively a team utilises the middle overs: in South Africa's case, it is 17.64, which is the best among all teams. India is next, with a difference of 13.93. Those are the only teams with a positive difference of more than 10.
England and New Zealand, on the other hand, struggle in the middle overs. Their bowlers concede about eight an over and don't take wickets too often, while their batsmen tend to get out quite a lot. That means their net numbers are in the negative. Sri Lanka haven't done too well either, primarily because of their batting: they've averaged less than 25, and scored at a run rate of only 6.88 in the middle overs.
TEAM-WISE BATTING AND BOWLING STATS IN THE MIDDLE OVERS, T20IS SINCE JAN 2012
Team
Bat Ave
Run Rate
Bat Ave X RR/6 (1)
Bowl Ave
Econ Rate
Bowl Ave X ER/6 (2)
Diff (1-2)
South Africa
35.67
7.60
45.18
22.09
7.48
27.54
17.64
India
33.47
7.53
42.00
23.69
7.11
28.07
13.93
Australia
30.96
8.59
44.32
31.67
7.62
40.22
4.10
Afghanistan
26.45
7.34
32.36
24.92
6.85
28.45
3.91
Pakistan
25.07
7.47
31.21
27.18
7.11
32.21
-1.00
West Indies
27.19
7.41
33.58
28.42
7.38
34.96
-1.38
Sri Lanka
24.43
6.88
28.01
24.31
7.72
31.28
-3.27
New Zealand
27.31
7.97
36.28
30.84
7.80
40.09
-3.82
England
27.55
7.80
35.82
30.41
7.98
40.45
-4.63
Bangladesh
22.78
7.11
26.99
25.72
7.41
31.76
-4.77
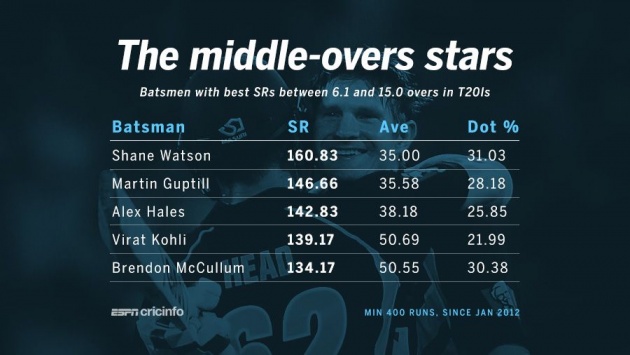
Among batsmen who have scored at least 400 runs in the middle overs, Shane Watson has a better strike rate than anyone else. He has scored at almost 161 runs per 100 balls, and his method has been a simple one: to bludgeon the ball for fours and sixes, and not bother too much about the singles and twos. Almost 65% of his runs have come in boundaries, easily the highest among these batsmen.
On the other hand, Virat Kohli's method has been quite different: his dot-ball percentage is incredibly low - only 22%, which means he scores off nearly four out of five balls. His dot percentage is easily the lowest among these batsmen, but he also has a relatively low boundary percentage of 49, which shows his method has been to rotate the strike, find the gaps and run hard - he has taken 260 singles and 36 twos in the middle overs. His aggregate of 659 runs is the highest among all batsmen in overs since 2012, and he also has an excellent average of 50.69.
South Africa's healthy stats in the middle overs are due to JP Duminy and Faf du Plessis. Duminy averages 70.71 during this phase, though his strike rate is only 110, while du Plessis averages almost 58 at a strike rate of 132. Two other batsmen who are outstanding strikers of the ball haven't made the most of the middle overs, though: AB de Villiers has been dismissed 18 times in 248 balls in these overs, and averages 17.05 (strike rate 124). Glenn Maxwell's ball-striking abilities are equally audacious, but he too hasn't handled the middle overs too well, getting dismissed 14 times in 179 balls, and averaging just 21.21, though his strike rate is an incredible 166.
BEST STRIKE RATES FOR BATSMEN IN MIDDLE OVERS (MIN 400 RUNS, SINCE JAN 2012)
Batsman
Runs
SR
Ave
Dot %
Boundary %
Shane Watson
420
160.83
35.00
31.03
64.76
Martin Guptill
427
146.66
35.58
28.18
57.61
Alex Hales
420
142.83
38.18
25.85
51.90
Virat Kohli
659
139.17
50.69
21.99
49.17
Brendon McCullum
455
134.17
50.55
30.38
51.43
Mohammad Hafeez
527
133.00
32.93
30.56
50.09
Faf Du Plessis
462
132.00
57.75
30.29
51.52
Shakib Al Hasan
402
124.83
30.92
35.40
54.73
Umar Akmal
475
119.00
31.66
31.08
43.37
Eoin Morgan
498
118.83
29.29
36.04
51.41
Batsmen from the top ten T20I teams
The list of bowlers with the best economy rates in the middle overs is dominated by spinners, which isn't surprising considering pace off the ball is the best way to curb runs during these overs, and that's also the passage of play when spin is used most often in the 20-over game. Sunil Narine has been outstanding in these overs, and West Indies will clearly miss him in the World T20, especially since the tournament will be played in India. The last three names in the list will all be in India for that tournament, though, and will probably play significant roles in how far their teams go in the World T20.
BEST ER IN THE MIDDLE OVERS, IN T20IS SINCE JAN 2012 (MIN 240 BALLS)
Bowler
Econ
Wkts
Ave
Dot %
Sunil Narine
5.09
11
25.45
43.64
Graeme Swann
5.57
15
14.86
42.92
Mohammad Nabi
5.85
15
24.20
42.20
Saeed Ajmal
6.15
11
29.09
43.27
Shakib Al Hasan
6.16
13
20.38
37.98
Imran Tahir
6.31
26
15.53
32.03
Ravindra Jadeja
6.36
11
28.90
40.00