Instrumentation and measurements
Chapter 02
Significant figures
– Significant figures is an indication of the precision of the measurement is obtained from the number of significant figures in which the result is expressed.
– For example, if a measurement reports that the line voltage is 220 V, it means that the line voltage is closer to 220 V than it is to 219 V or 221 V.
– Alternatively, if the reported value is 220.0 V, it means that the value is closer to 220.0 V than it is to 219.9 volt or 220.1 volt.
– Talking in terms of significant figures, it is 3 in the former case and 4 in the latter case.
Addition and subtraction
After performing the operation, write the result rounded off to the same number of decimal places as that of the least precise number.
Example
Four capacitors of values 45.1 and 0.48 µF are connected in parallel. Find the value of the equivalent capacitor to the appropriate number of significant figures.
Solution
The straightforward addition yields 138.10 µF. Round it off to the same number of decimal places as that of the least precise number, namely 45.1 µF. The acceptable value is 138.1 µF.
Multiplication and division
After performing the operation, the result is rounded off to the same number of significant figures as that of the least precise number.
Example
A current of 3.12 A is flowing through a resistor of 53.635 Ω. Find the value of the voltage drop across the resistor to the appropriate number of significant figures.
Solution
The straightforward multiplication yields 167.3412 V. Rounding it off to three significant figures, the value to be reported is 167 V.
Measurement error combinations
Sum of quantities
When a quantity is calculated as the sum of two measurements, the total error is the sum of the absolute errors in each measurement.
E = (V1 ± ΔV1) + (V2 ± ΔV2)
E = (V1 + V2) ± (ΔV1 + ΔV2)
Difference of quantities
E = (V1 ± ΔV1) − (V2 ± ΔV2)
E = (V1 − V2) ± (ΔV1 + ΔV2)
Product of quantities
When a calculated quantity is the product of two or more quantities, the percentage error is the sum of the of the percentage errors in each quantity.
P = (E + ΔE)(I + ΔI)
P = EI ± EΔI ± IΔE ± ΔEΔI
Since ΔEΔI is very small
P ≈ EI ± (EΔI + IΔE)
% error in P = (EΔI + IΔE)/EI × 100
% error in P = (% error in I) + (% error in E)
Quotient of quantities
Here again it can be shown that the percentage error is the sum of the percentage errors in each quantity.
% error in E/I = (% error in E) + (% error in I)
Quantity raised to a power
When a quantity A is raised to a power B, the percentage error in AB can be shown to be
% error in AB = B(% error in A)
Statistical analysis
Arithmetic mean
– When a number of measurements of a quantity are made and the measurements are not all exactly equal, the best approximation to the actual value is found by calculating the arithmetic mean of the results.
– For n measured values of x1, x2, x3, ………, xn, the arithmetic mean is
– When determining the mean value of a number of readings, it is sometimes found that one or two measurements differ from the mean by a much larger amount than any of the others. In this case, it is justifiable to reject these few readings as mistakes and to calculate the average value from the other measurements. This action should not be taken when more than a small number of readings differ greatly from the mean. Instead, the whole series of measurements should be repeated.
Deviation
– The difference between any one measured value and the arithmetic mean of a series of measurements is termed the deviation. Mathematically,
– The deviations (d1, d2, d3, ………, dn) may be positive or negative, and the algebraic sum of the deviations is always zero.
Average deviation
– The degree to which numerical data spread about the average value is called variation or dispersion of the data. One measure of variation is the average deviation. The average deviation may be used as an expression of the precision of a measuring instrument.
– A low value for average deviation indicates a precise instrument.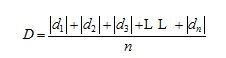
Standard deviation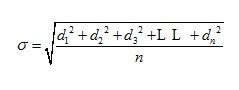
Probable error
– A convenient measure of precision is the quantity r which is called probable error. The reason for this name is the fact that half the observed values lie between the limits ±r. If we determine r as the result of n measurements and then make an additional measurement, the chances are 5050 percent that the new value will lie between r and +r. That is, the chances are even that any one reading will have an error not greater than ±r.
– For the case of a large number of measurements in which only random errors are present, it can be shown that the probable error in any one measurement is 0.6745 times the standard deviation.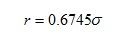
Source:
Electronic Instrumentation and Measurements 2nd edition by David A. Bell
This is the end of Chapter 2 Measurement Errors.